
MappIT can be helpful in many IT Strategy, Governance and Architecture real cases.
In my previous example I’ve shown how to leverage the tool to collect and analyse the application landscape; in this second tutorial I would like to demonstrate how to use the tool for Infrastructure assessment.

When we talk about infrastructure we refer to all pieces of hardware that are used inside the company; this include PC, Tablet, Phones, Server, Network equipment, …
To start you need to collect data about your infrastructure; there is a specific master mask in MappIT for this purpose:

Through this form you can insert typical infrastructure information that you can typically collect about your infrastructure, like:
- Name of the device
- Type (server, client, network equipment,…)
- Geographic site where the infrastructure is hosted
- Environment where it is used (Development, Test, Production,…)
- Layer in the physical architecture where the device is involved tool (Frontend layer, Application layer , Communication/Integration layer, DB layer,….)
- Implementation ageing (how old is the infrastructure
- HW Vendor
- HW Model
In case of Client or Server you can add additional information like:
- How many computers and how many virtual instance do you have
- Storage type
- Operating system
- Number and average usage of the CPU
- Number of GB and average usage of the RAM
In many cases you want also to speed-up the data entry task, this can be done showing the data in a grid, cut data from an excel file (containing the same rows) and pasting into the grid the data…and that’s all, all your data will be there.
Again after you have finished to map all you Infrastructure you can start analysing it through MappIT analyse features

For example you can analyse how many server or Tablet you have installed in the different sites:

You can also use other visualization tools to dig into the data.

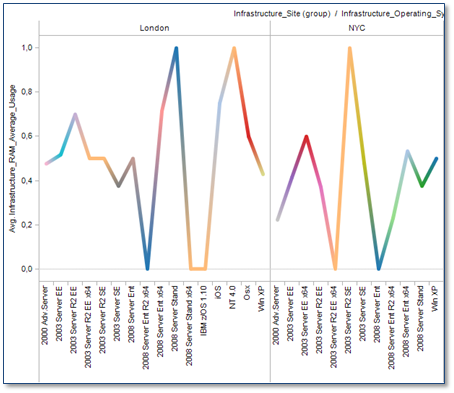
..or for example verify the level of usage of your infrastructure across different dimensions.
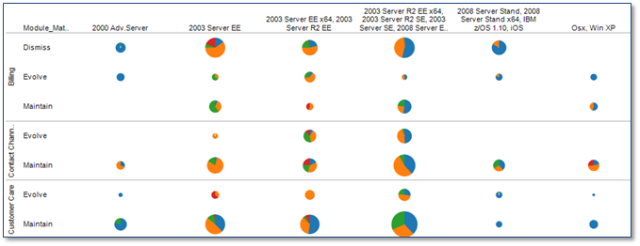
However till now there is nothing more than an excel file; however thing change if you want to correlate data coming from Infrastructure architecture with data coming from Application architecture; this task cannot be done very easily through excel while using MappIT you can insert this information very easily through a coverage data entry map.

Every time an infrastructure element (in columns) support an application (in rows) you can map it with a number that represent the level of usage of this infrastructure due to the application (typically in term of processor usage but you can decide to use also other criteria).
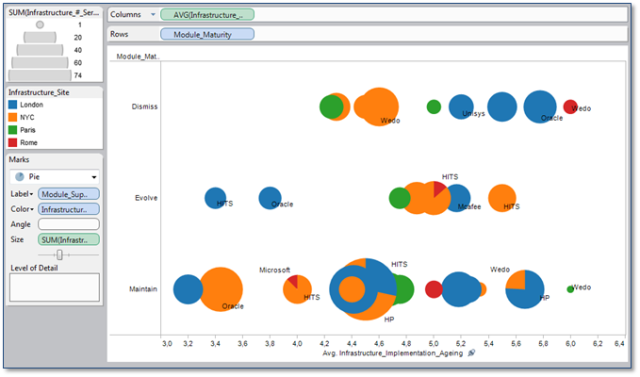
After you have finished to map the correlation between applications and infrastructures you can then again analyse it through MappIT or external tools.
…and you can do where sophisticated analysis like the following: distribution of number of server and their usage respect to application maturity and application supplier and infrastructure ageing.
Stay tuned, next time we will move from technical point of view to the spending/sourcing point of view.


Pingback: MappIT 2.0 – A comprehensive view of your IT Architecture and Governance | IT Governance and Enterprise Architecture made easy